Trying Out Blogdown
Getting in some practice including various elements in a blogdown post
By Desirée De Leon in R
June 13, 2019
Hello!
This is my very first blog post using an R Markdown file within blogdown. I’m going to demonstrate how we can include the following in a single post:
- R code
- A plot
- An image (via markdown syntax)
- An image (via
knitr::include_graphics) - A relative link to another section in my site
- A demo using a dataset that I have read in
1) Iris data set
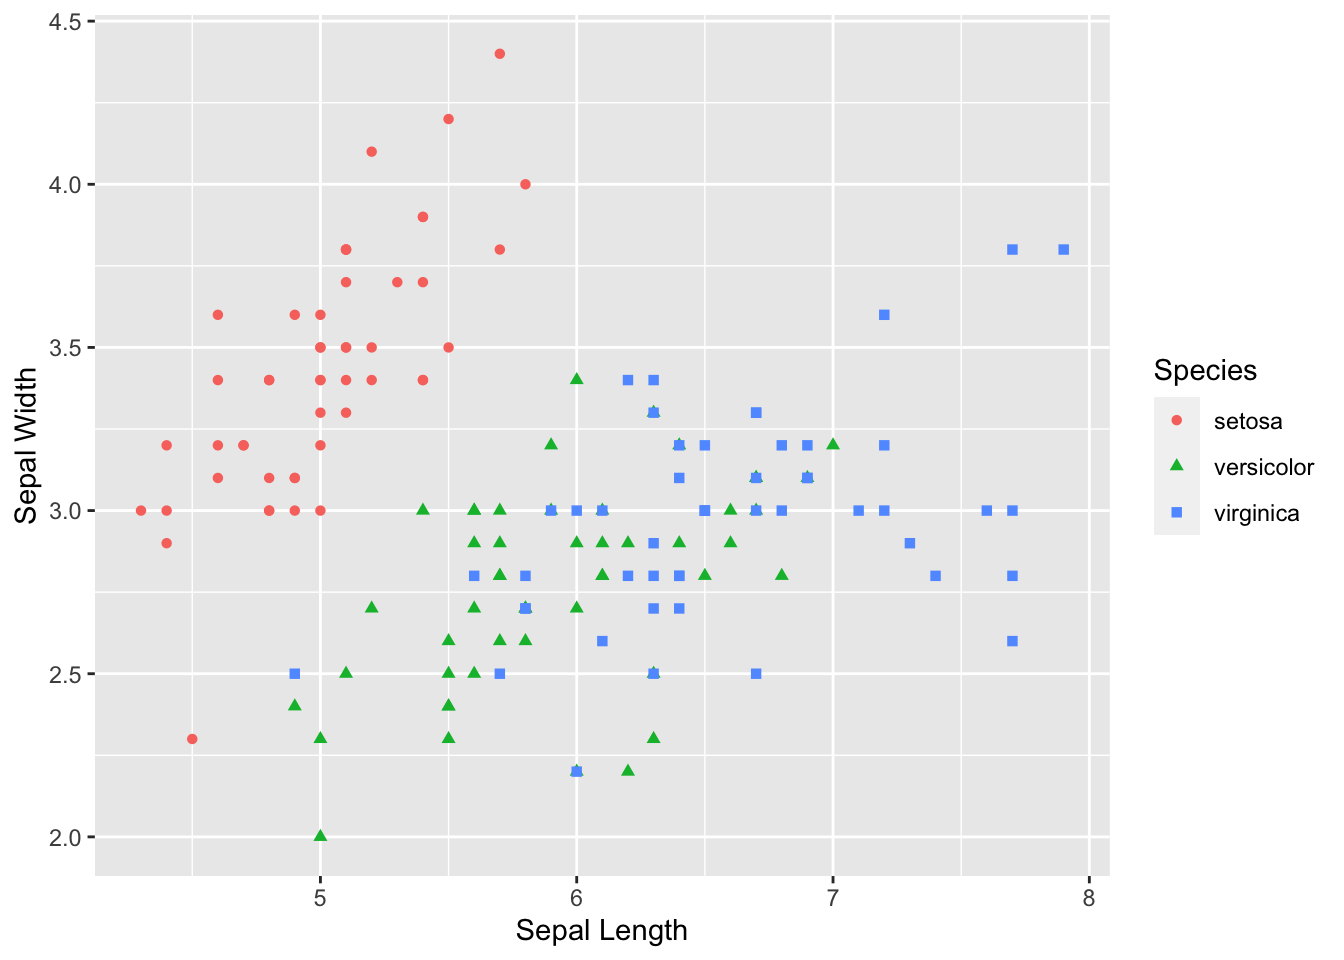
Let’s make a plot using the iris data set in ggplot2.
library(ggplot2)

# Dataset
head(iris)
##   Sepal.Length Sepal.Width Petal.Length Petal.Width Species
## 1          5.1         3.5          1.4         0.2  setosa
## 2          4.9         3.0          1.4         0.2  setosa
## 3          4.7         3.2          1.3         0.2  setosa
## 4          4.6         3.1          1.5         0.2  setosa
## 5          5.0         3.6          1.4         0.2  setosa
## 6          5.4         3.9          1.7         0.4  setosa
\# 2) Plotting
scatter <- ggplot(data=iris, aes(x= Sepal.Length, y = Sepal.Width))
scatter + geom_point(aes(color=Species, shape=Species)) +
  xlab("Sepal Length") + ylab("Sepal Width")
\# 3) Embedding a bundled image
Using markdown syntax  to generate the image below:
I’m still wondering how to get the caption to show up when I embed images in this way.

\# 4) Using knitr
We can also accomplish this with a code chunk, setting the following parameter out.width="500px", fig.align='center'
knitr::include_graphics("valentin-lacoste-1675701-unsplash.jpg")
\# 5) Relative links
I can also include some relative links to, for example, tell you to check out this other section of my site!
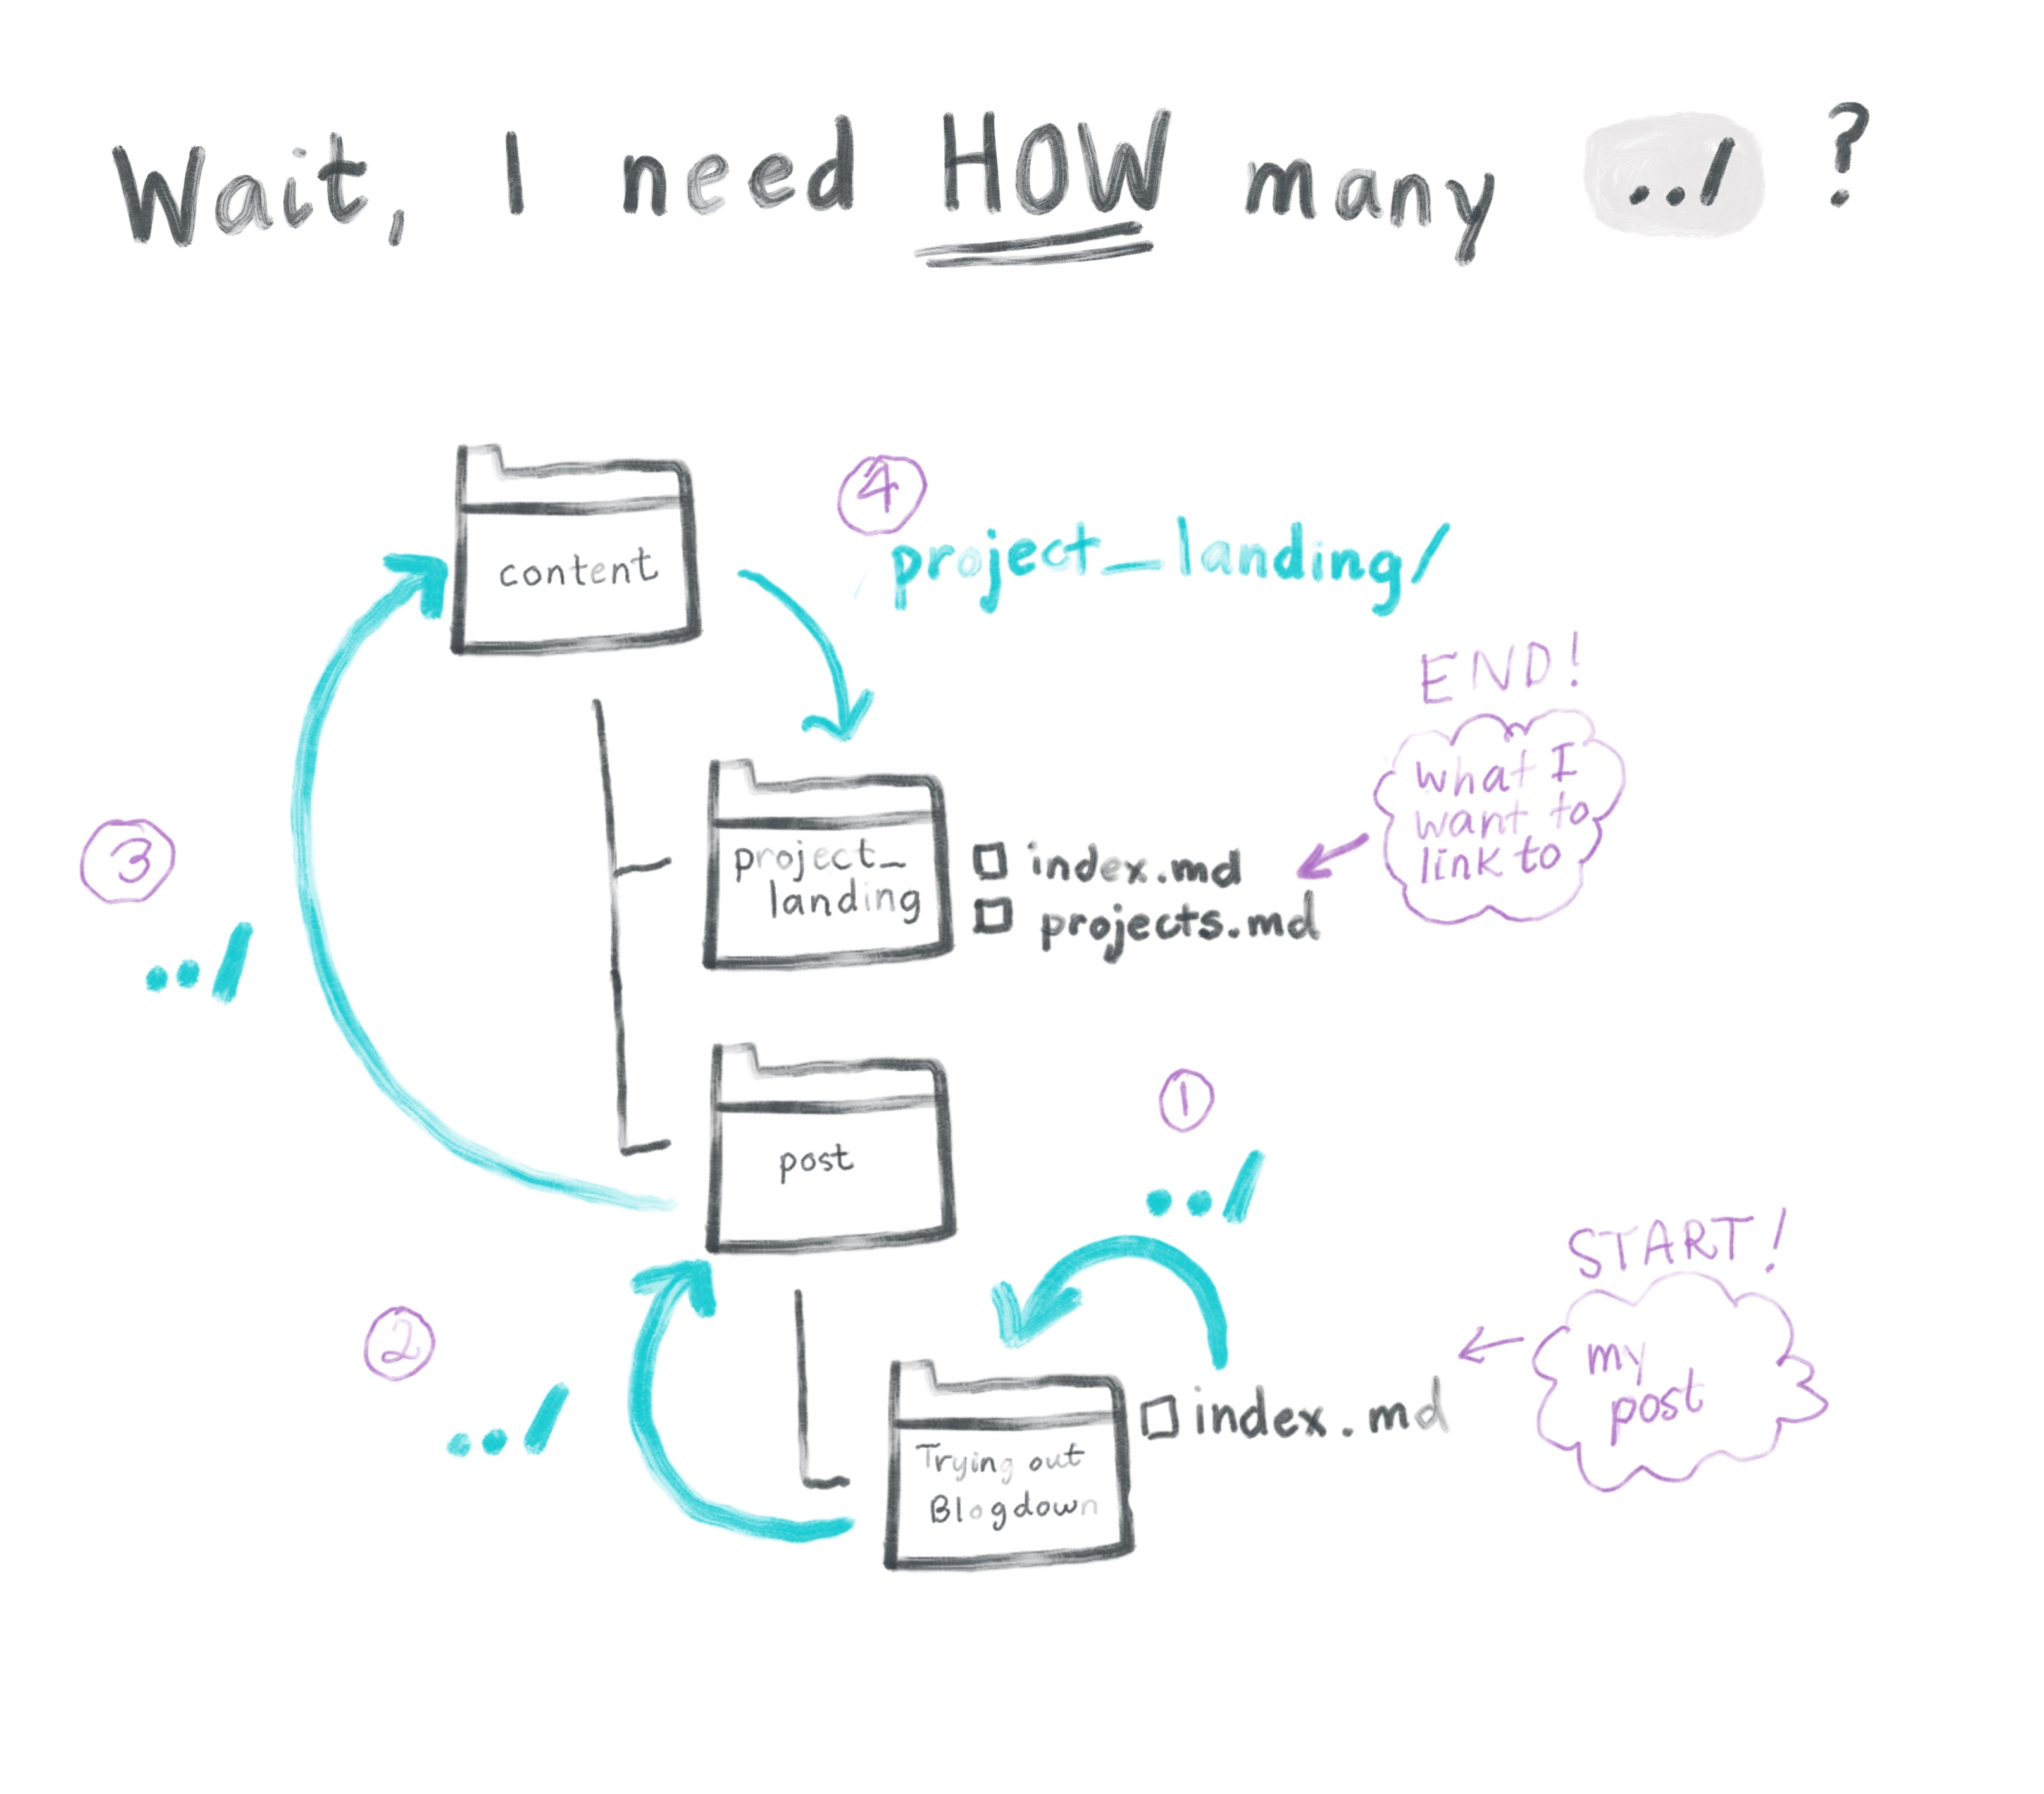
The structure of relative links is a bit confusing. When specifying the location of the page you want to get to, the reference point is the directory that your post lives in (and NOT the project root directory).
This is a bit weird, so the fastest way to figure it out is probably by trial-and-error, but I’m a visual learner, so I had to diagram this out:
6) Reading in a data set
Sometimes its nice to call in iris and other times, you just wanna go your own way. Here’s what it looks like to read in a .csv file that I have stored in the same directory as this blog post. This file has information about behavior or rhesus macaque monkeys.
library(dplyr)
library('DT')
We’ll assign it to `behavior`.
behavior <- readr::read_csv("aggression_behavior.csv")
## Rows: 214 Columns: 11
## ── Column specification ────────────────────────────────────────────────────────
## Delimiter: ","
## chr (3): focal, compound, infant?
## dbl (8): birthyr, obyear, rank, attack_all, chase_all, threatcontact_all, th...
##
## ℹ Use `spec()` to retrieve the full column specification for this data.
## ℹ Specify the column types or set `show_col_types = FALSE` to quiet this message.
Let’s just take a quick look at what the structure of this data set is:
dplyr::glimpse(behavior)
## Rows: 214
## Columns: 11
## $ focal               <chr> "bs9", "gk3", "se8", "qq8", "vd8", "qv5", "sr8", "…
## $ compound            <chr> "a1", "a1", "a1", "a1", "a1", "a1", "a1", "a1", "a…
## $ birthyr             <dbl> 2003, 1991, 2001, 2001, 2001, 1996, 2001, 2001, 19…
## $ obyear              <dbl> 2008, 2007, 2008, 2008, 2008, 2008, 2008, 2008, 20…
## $ rank                <dbl> 3, 1, 1, 3, 3, 3, 2, 2, 1, 2, 1, 2, 2, 2, 3, 2, 3,…
## $ `infant?`           <chr> "N", "Y", "N", "N", "Y", "Y", "N", "Y", "N", "N", …
## $ attack_all          <dbl> 0.000000, 0.000000, 0.000000, 0.000000, 0.000000, …
## $ chase_all           <dbl> 0.000000, 0.000000, 0.000000, 0.000000, 0.000000, …
## $ threatcontact_all   <dbl> 0.000000, 0.000000, 0.000000, 2.232060, 0.997506, …
## $ threatnocontact_all <dbl> 0.000000, 0.000000, 0.000000, 2.976080, 1.995010, …
## $ agg_in              <dbl> 0.000000, 0.000000, 0.000000, 5.208140, 2.992516, …
And now, let’s use the DT package to make this into a table that’s easier to manage.
datatable(behavior)